
See the board
This is the instrument.
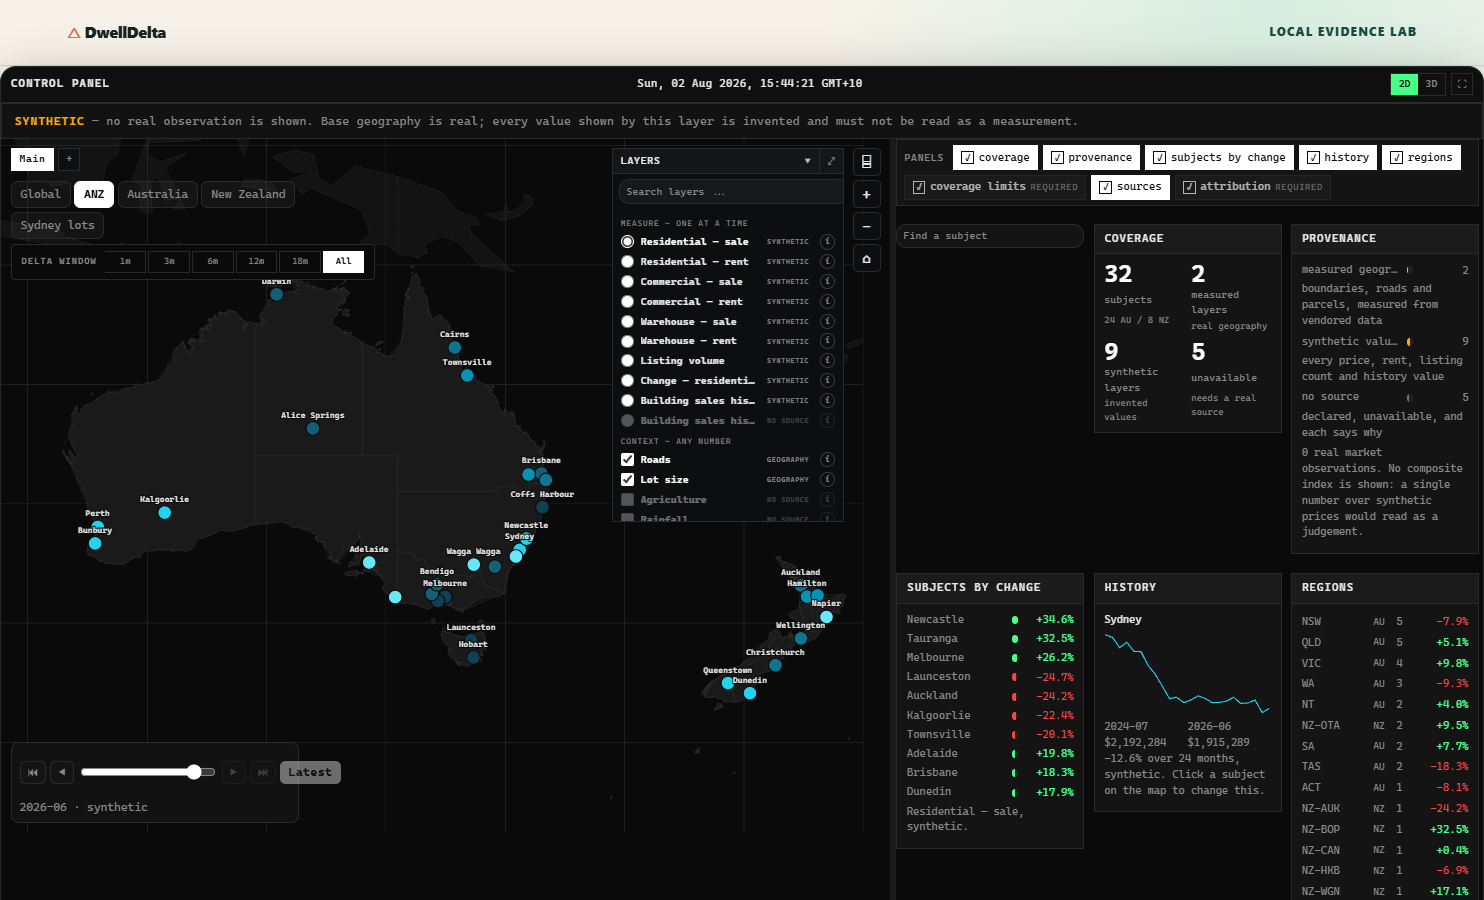
Below is the DwellDelta control panel, captured from release v0.9.66. Not a mockup, not a redraw — the board as it renders, screenshotted and placed here unedited.
As it opens
Australia and New Zealand, one board
Thirty-two subjects across both countries. The measure is chosen one at
a time on the left; context layers stack underneath it. Every layer carries its own
provenance tag — synthetic, geography, or no source —
on the layer itself, so a reader never has to guess which is which.
The delta
Change is a layer, not a footnote
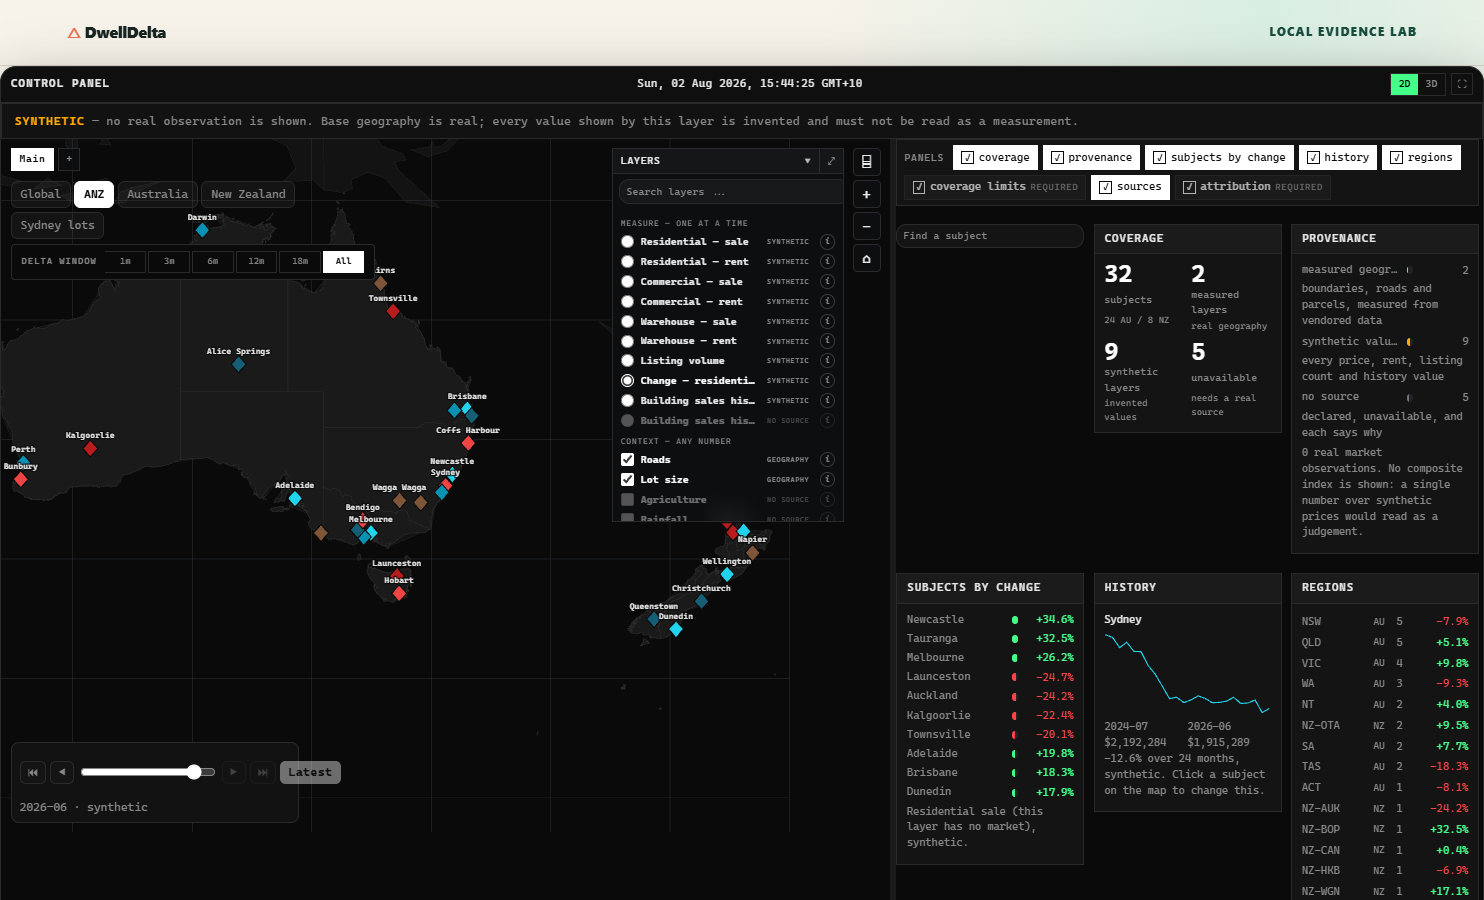
Switch the measure to change and the markers recolour by direction of movement over the delta window — 1, 3, 6, 12, 18 months or the full series. The name of the product is the thing it puts on the map.
The rail
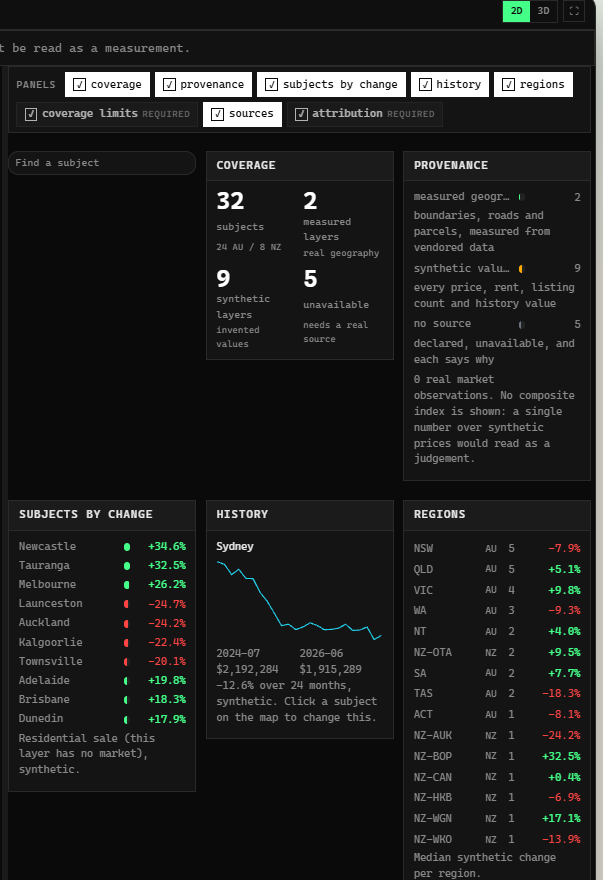
Panels that say what they do not know
Coverage counts the layers that are measured against the ones that are invented and the ones with no source at all. Provenance breaks the same total down again. Neither is a badge — they are counts, and they move when the data does.
Provenance of these images
Where these came from
- Captured from
dwelldelta-appv0.9.66, commitbf227de6308b16f48e59b12810217ae0496be33e. - Served locally from the tagged tree and screenshotted at 1500×950. No editing, no compositing, no retouching.
- Recorded in
board/PROVENANCE.json, which this site's tests check against this page — if one names a different release from the other, the tests fail.
A live embed would mean vendoring the board's source, which is AGPL-3.0-only and contains code derived from World Monitor, © 2024–2026 Elie Habib. That is a licensing decision, and it has not been taken.