
The Delta Snapshot · September 2026
Fewer sales; NSW unemployment and lending little changed on a year earlier
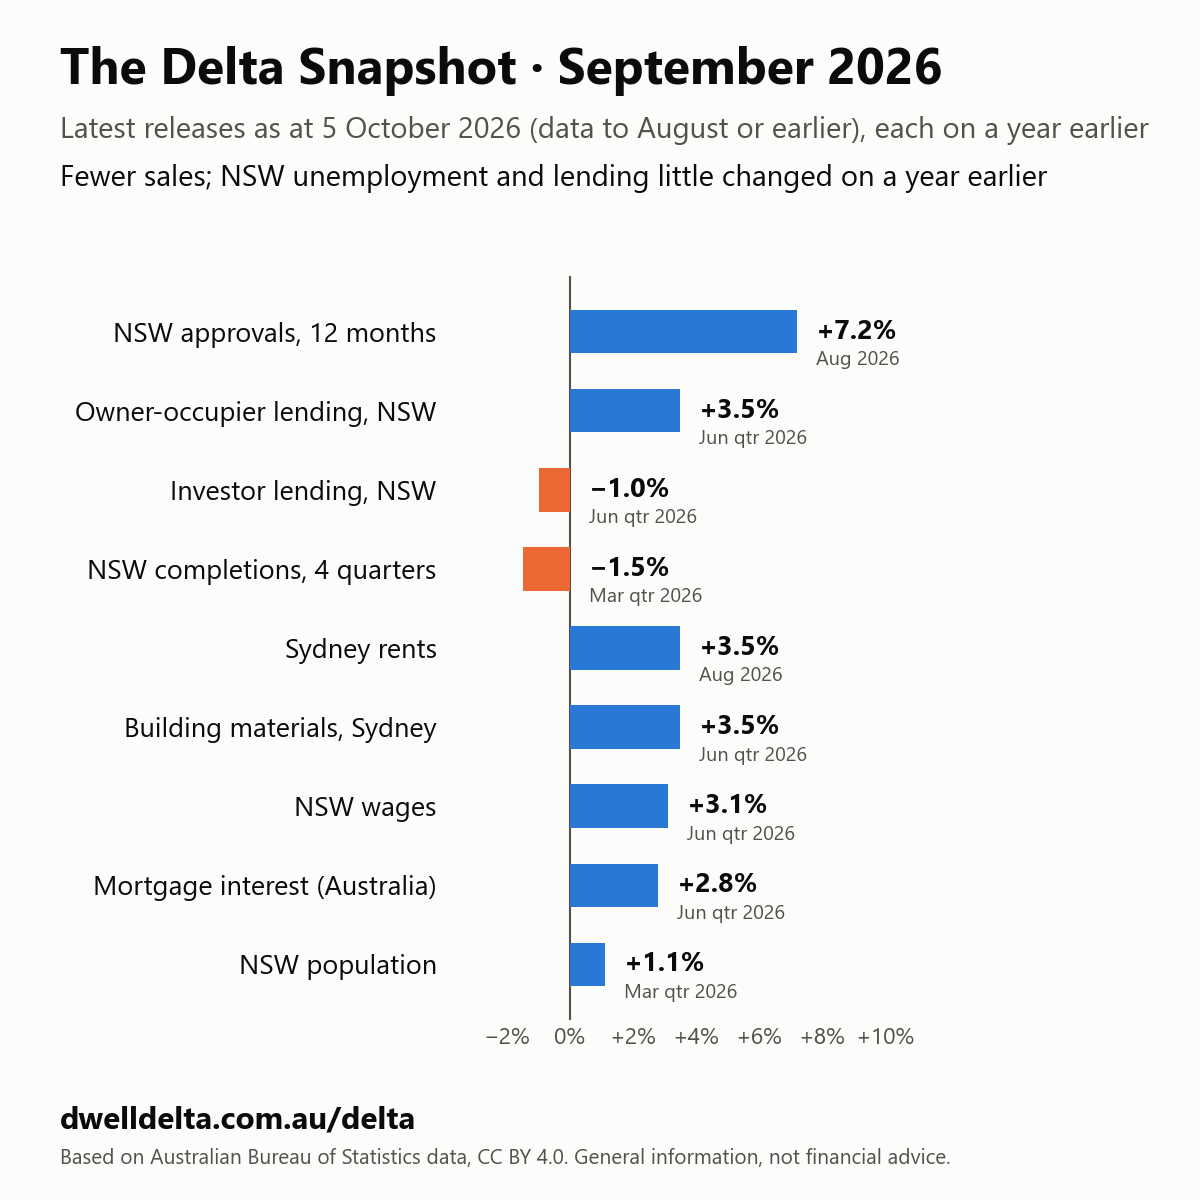
On a year earlier, the change so far is in how many homes sell: Sydney house sales were about a fifth lower in the June quarter. NSW unemployment (4.3%, up from 4.2%) and new NSW lending (owner-occupiers +3.5%, investors −1.0%) had moved little on a year earlier, though both kinds of lending have fallen since December. Australia-wide, unemployment rose to 4.6%, from 4.2%. All of this predates the 29 September rate rise.
What the headlines said
September ended with a sixth straight monthly fall in home values, as widely reported on 1 October, and some economists said the market was heading for its worst performance in four decades. On 29 September the Reserve Bank lifted the cash rate to 4.60%, its highest since 2011.
What our data says
The Delta Snapshot sets out the numbers we may republish, each at its latest release as at 5 October 2026, against the same period a year earlier. Rows marked (Australia) are national; the rest are NSW or Sydney. No row covers September itself: each source publishes weeks or months after the period it measures.
| Latest | Value | On a year earlier | |
|---|---|---|---|
| NSW dwellings approved, 12 months | Aug 2026 | 53,525 | +7.2% |
| Sydney rents (CPI) | Aug 2026 | index | +3.5% |
| NSW unemployment rate | Aug 2026 | 4.3% | up from 4.2% |
| Unemployment rate (Australia) | Aug 2026 | 4.6% | up from 4.2% |
| Investor share of outstanding home loans, all ADIs (Australia) | Aug 2026 | 32.7% | up from 32.2% |
| New investor lending, NSW | Jun qtr 2026 | $12.6b | −1.0% |
| New owner-occupier lending, NSW | Jun qtr 2026 | $17.4b | +3.5% |
| Sydney median house price (first counts) | Jun qtr 2026 | $1,487,600 | +1.9% |
| NSW wages (WPI) | Jun qtr 2026 | index | +3.1% |
| NSW homes completed, 4 quarters | Mar qtr 2026 | 44,700 | −1.5% |
| Sydney house-building materials | Jun qtr 2026 | index | +3.5% |
| Mortgage interest, employee households (Australia) | Jun qtr 2026 | index | +2.8% |
| Interest-only share of new home loans (Australia) | Jun qtr 2026 | 23.6% | up from 20.8% |
| NSW population | Mar qtr 2026 | 8,670,105 | +1.1% |
| NSW net interstate migration, quarter | Mar qtr 2026 | −4,970 | against −5,617 |
Where we differ
On a year earlier, the change so far is in how many homes sell. As our weekly issue 2026-w40 found, Sydney house sales in the June quarter were about a fifth lower than a year earlier, while the median house price was 1.9% higher, first count against first count.
Jobs and lending had moved little on a year earlier, but both are moving. NSW unemployment was 4.3% in August, up from 4.2%; across Australia it rose to 4.6%, from 4.2%. New NSW lending in the June quarter was 3.5% higher for owner-occupiers and 1.0% lower for investors than a year earlier, but since their December peak, after a surge late in 2025, they have fallen 11.1% and 21.0% (2026-w40).
Building has not stopped. NSW approved 53,525 dwellings in the twelve months to August, 7.2% more than a year earlier, and completed 44,700 homes in the year to March, 1.5% fewer, while its population grew by about 97,000 people.
Three things to watch.
- The interest-only share of new home loans across Australia rose to 23.6%, from 20.8% a year earlier.
- Investors hold 32.7% of outstanding home loans at all authorised deposit-taking institutions (ADIs) in Australia, up from 32.2%. August includes a $14.1bn fall in one lender's housing book that the published figures do not explain, so read that change with care.
- Sydney rents rose 3.5% in the year to August and NSW wages 3.1% in the year to June. Mortgage interest for employee households across Australia rose 2.8%, and the materials for building Sydney houses 3.5%.
All of these figures predate the 29 September rate rise.
How we measured
- Each figure is the source's latest published period, set against the same period a year earlier in the same file. Most ABS series are revised a little after first release.
- Approvals are the twelve months to the month shown and completions the four quarters to the quarter shown, each against the same span a year earlier: one month or one quarter of a volatile flow misleads.
- Sydney's median house price is compared first count against first count, each from the ABS release that first published it: the ABS revises medians after first release.
- The headline claims are quoted as reported; we reproduce no figure from those reports.
- This edition is frozen with the checksum of every file read, and is not updated. The Delta Snapshot is built on the first Monday of each month.
Is your rent fair? Check it in a minute, and add yours to help others.
General information, not financial advice.
Sources
- Based on Australian Bureau of Statistics data: Building Approvals (8731.0); Producer Price Indexes (6427.0); Consumer Price Index (6401.0); Building Activity (8752.0); Labour Force (6202.0); Lending Indicators (5601.0); Selected Living Cost Indexes (6467.0); National, state and territory population (3101.0); Total Value of Dwellings (6432.0); Wage Price Index (6345.0), licensed under CC BY 4.0 (creativecommons.org/licenses/by/4.0). No endorsement by the ABS is implied.
- Based on Australian Prudential Regulation Authority (APRA) data: Monthly Authorised Deposit-taking Institution Statistics; Quarterly Authorised Deposit-taking Institution Property Exposures, © Australian Prudential Regulation Authority, licensed under CC BY 3.0 AU (creativecommons.org/licenses/by/3.0/au). No endorsement by APRA is implied.
- Headlines: the sixth monthly fall as reported by ABC News on 1 October 2026; the four-decades view as widely reported that week.
- Rate decision: Reserve Bank of Australia, 29 September 2026. No endorsement by the Reserve Bank is implied.