
The Delta Snapshot · October 2026
Unemployment at its highest since 2021; in NSW the rise is smaller than nationally
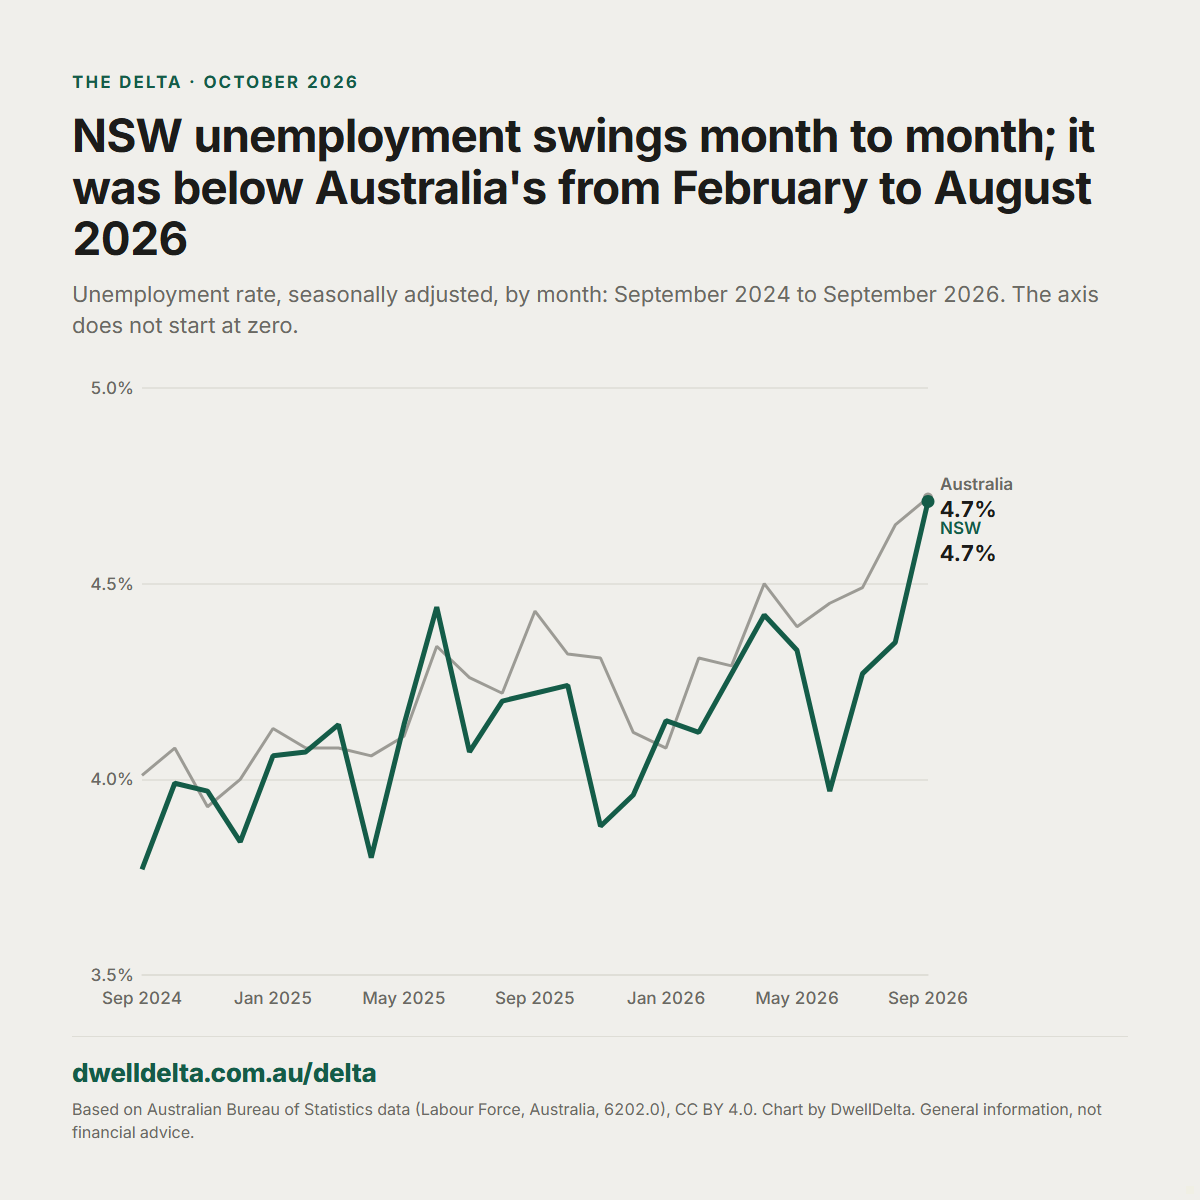
Across Australia, unemployment has risen steadily: 4.6% over the three months to September, 0.3 points above a year earlier, after gaps of 0.2 and 0.3 points over the three months to July and to August. In NSW the rise is smaller and uneven: over the twelve months to September the rate averaged 4.2%, against 4.1% the year before, 0.1 points higher, where Australia's rose 0.2. A low June held the three months to July and to August level with a year earlier (4.2% each time); September's 4.7% lifted the three months to September to 4.4%, against 4.2%. September's single figure overstates the rise. Completions rose, much of it in one quarter: NSW completed 49,303 homes in the four quarters to June, 15.6% more than a year earlier, much of it the June quarter against a weak one a year earlier, a first estimate the ABS revises.
What the headlines said
Home values fell for a sixth straight month in September, as widely reported on 1 October, and forecasters talked of deeper falls to come, as reported through October. On 15 October the ABS put the unemployment rate at 4.7% for September, unchanged; it was reported as a post-COVID high, with fewer people in work than in August. The question behind both: will job losses force more owners to sell?
What our data says
The Delta Snapshot sets out the numbers we may republish, each at its latest release as frozen on the morning of 2 November 2026, against the same period a year earlier. Rows marked (Australia) are national; the rest are NSW or Sydney. No row covers October itself: each source publishes weeks or months after the period it measures.
| Latest | Value | On a year earlier | |
|---|---|---|---|
| NSW dwellings approved, 12 months | Aug 2026 | 53,525 | +7.2% |
| Sydney rents (CPI) | Sep 2026 | index | +3.5% |
| NSW unemployment rate | Sep 2026 | 4.7% | up from 4.2% |
| Unemployment rate (Australia) | Sep 2026 | 4.7% | up from 4.4% |
| Investor share of outstanding home loans, all ADIs (Australia) | Sep 2026 | 32.6% | up from 32.2% |
| New investor lending, NSW | Jun qtr 2026 | $12.6b | −1.0% |
| New owner-occupier lending, NSW | Jun qtr 2026 | $17.4b | +3.5% |
| Sydney median house price (first counts) | Jun qtr 2026 | $1,487,600 | +1.9% |
| NSW wages (WPI) | Jun qtr 2026 | index | +3.1% |
| NSW homes completed, 4 quarters | Jun qtr 2026 | 49,303 | +15.6% |
| Sydney house-building materials | Sep qtr 2026 | index | +3.7% |
| Mortgage interest, employee households (Australia) | Jun qtr 2026 | index | +2.8% |
| Interest-only share of new home loans (Australia) | Jun qtr 2026 | 23.6% | up from 20.8% |
| NSW population | Mar qtr 2026 | 8,670,105 | +1.1% |
| NSW net interstate migration, quarter | Mar qtr 2026 | −4,970 | against −5,617 |
Where we differ
Australia-wide, unemployment has been rising steadily. September's 4.7% is the highest in the ABS's seasonally adjusted series since October 2021, which is what the reports call a post-COVID high; August's rate also rounds to 4.7%. Averaged over three months, so that one month's swing does not decide it, the rate was 4.4% in the three months to July, 4.5% to August and 4.6% to September: 0.2, 0.3 and 0.3 points above the same three months a year earlier. It was above a year earlier in 11 of the last 12 months.
In NSW, the rise is smaller than nationally, and uneven. Over the twelve months to September, NSW unemployment averaged 4.2%, against 4.1% in the twelve months before: 0.1 points higher, where Australia's rose 0.2. It was above a year earlier in 10 of the 12 months, before rounding, but the state's monthly figures swing widely. In the three months to April and to May it was 4.3%, against 4.0% a year earlier. A low June, 4.0% against 4.4% in June 2025, held the three months to July and to August level with a year earlier, at 4.2%. September's 4.7% lifted the three months to September to 4.4%, against 4.2%. September's single figure overstates the rise; October's figure, due from the ABS on 19 November, will show whether the jump holds.
Our data cannot yet show forced sales. As our 2026-w41 issue found, the share of home-loan balances at banks and other deposit-takers 30 to 89 days in arrears was level with a year earlier in June, though it had risen for two quarters. That predates September's unemployment figure and the September rate rise, and owners who sell before they fall behind on their loans do not appear in arrears at all.
Completions rose, much of it in one quarter. NSW completed 49,303 homes in the four quarters to June, 15.6% more than a year earlier (2026-w43 has the detail), but much of the rise is the June quarter set against a weak one: June 2025's 9,291 homes were NSW's fewest in a quarter since September 2013, and June 2026's 13,332 is the ABS's first estimate, which it revises in January. NSW also approved 53,525 homes in the twelve months to August, 7.2% more. Our latest Sydney median house price is for the June quarter, so it covers at most the first three months of the falls reported, and it is a median of sales, not the index those reports describe.
All of these figures predate the 3 November rate decision.
How we measured
- Each Snapshot figure is the source's latest published period, set against the same period a year earlier in the same file. Most ABS series are revised a little after first release.
- Unemployment is the ABS's seasonally adjusted rate. The three-month figures are the average of the three monthly rates, against the average of the same three months a year earlier; we looked at the windows ending in each month from April to September, and at the twelve months to September against the twelve before, so that no single month or choice of months decides the reading. Differences in points are taken before rounding, so one can differ by 0.1 from the difference of the two rounded rates.
- The date of October's unemployment figure is from the ABS's release page, read through our robots check and kept with this edition on 2 November 2026.
- Approvals are the twelve months to the month shown and completions the four quarters to the quarter shown, each against the same span a year earlier.
- Sydney's median house price is compared first count against first count, each from the ABS release that first published it.
- The headline claims are as reported; we reproduce no figure from those reports.
- The investor share compares September with September a year earlier, so it still includes the fall in one lender's housing book in August that the published figures do not explain (our September Snapshot): read that change with care.
- This edition is frozen with the checksum of every file read, and is not updated.
Is your rent fair? Check it in a minute, and add yours to help others.
General information, not financial advice.
Sources
- Based on Australian Bureau of Statistics data: Building Approvals (8731.0); Producer Price Indexes (6427.0); Consumer Price Index (6401.0); Building Activity (8752.0); Labour Force (6202.0); Lending Indicators (5601.0); Selected Living Cost Indexes (6467.0); National, state and territory population (3101.0); Total Value of Dwellings (6432.0); Wage Price Index (6345.0), licensed under CC BY 4.0 (creativecommons.org/licenses/by/4.0). No endorsement by the ABS is implied.
- Based on Australian Prudential Regulation Authority (APRA) data: Monthly Authorised Deposit-taking Institution Statistics; Quarterly Authorised Deposit-taking Institution Property Exposures, © Australian Prudential Regulation Authority, licensed under CC BY 3.0 AU (creativecommons.org/licenses/by/3.0/au). No endorsement by APRA is implied.
- Headlines: as reported on 1 and 15 October 2026 and through October, cited by date and not named, because DwellDelta names only sources it can use commercially. They were found by web search and not read in full; we reproduce no figure from them.