
The Delta · Weekly · 28 September – 4 October 2026
Sydney's sales fell far faster than its prices
Allowing for the way the ABS revises its first count, Sydney house sales in the June quarter were about a fifth lower than a year earlier (−19.6% to −23.0%), while the median house price was 1.4% to 2.2% higher. So far the change is in how many homes change hands, more than in what they sell for. These figures end on 30 June, before the rate rise.
What the headlines said
Home values fell for a sixth straight month in September, as widely reported on 1 October. On 29 September the Reserve Bank lifted the cash rate to 4.60%, its highest since 2011.
What our data says
We used the Australian Bureau of Statistics' records of actual sales. The ABS's first count of a quarter is always revised up later, by different amounts each time, so we show two comparisons: first count against first count, and this June's first count raised the way earlier quarters were raised, against last June as revised.
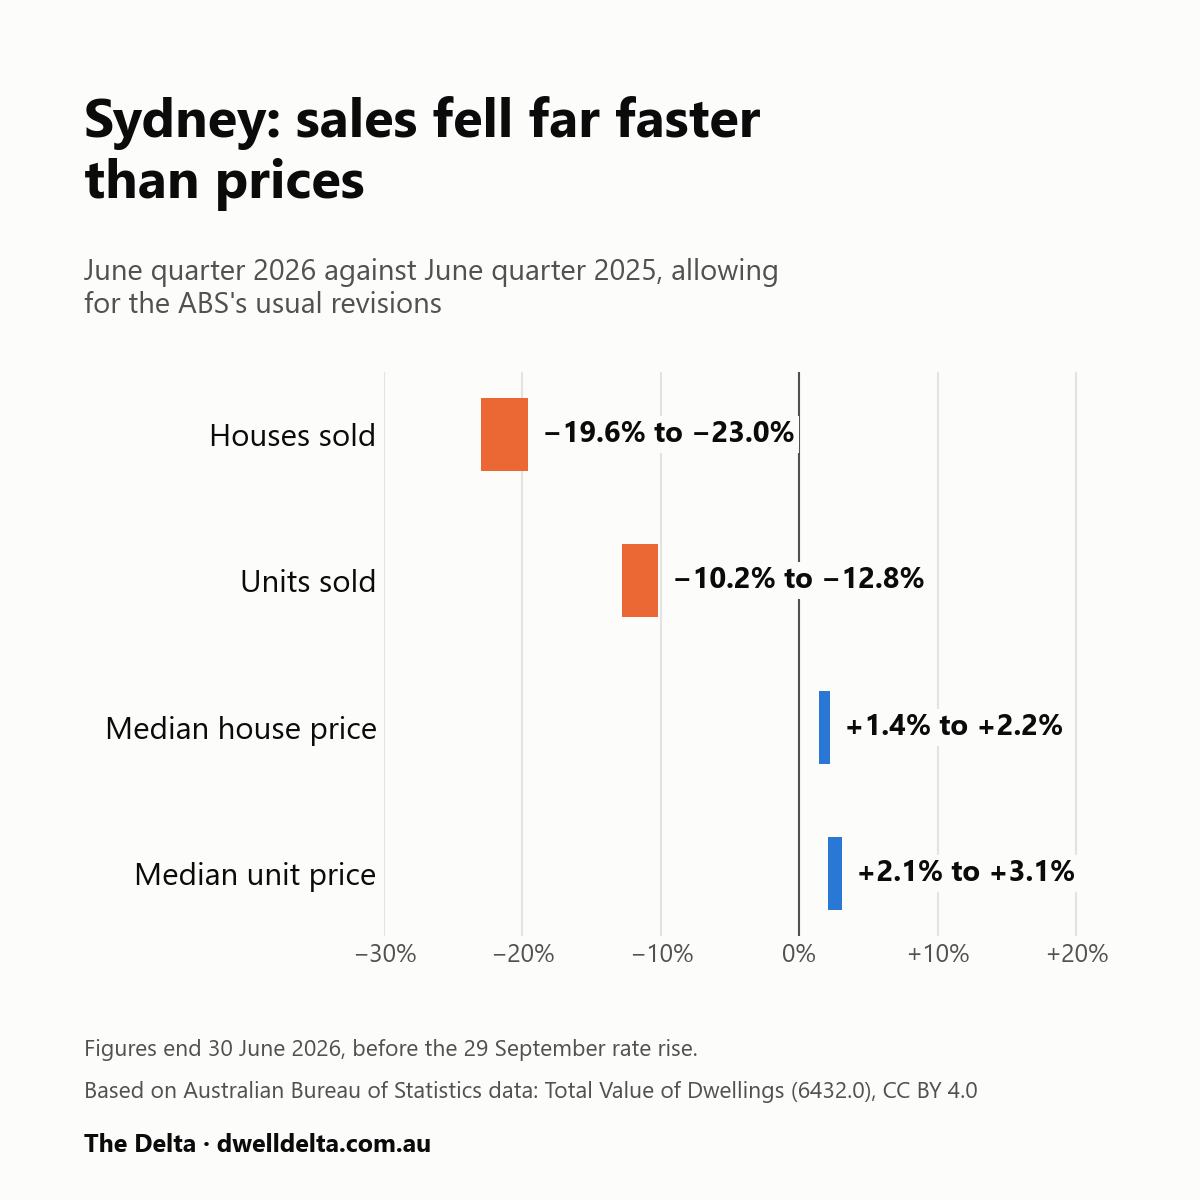
| Sydney, June quarter 2026 | First count | First count against first count | Allowing for the usual revisions |
|---|---|---|---|
| Houses sold | 8,932 | −26.8% | −19.6% to −23.0% |
| Median house price | $1,487,600 | +1.9% | +1.4% to +2.2% |
| Units sold | 9,891 | −21.1% | −10.2% to −12.8% |
| Median unit price | $840,000 | +1.8% | +2.1% to +3.1% |
New lending in NSW, June quarter 2026:
| On a year earlier | From December 2025 | |
|---|---|---|
| Investors | −1.0% | −21.0% |
| Owner-occupiers | +3.5% | −11.1% |
Sydney rents were 3.5% higher in August than a year before.
Where we differ
Sales fell far faster than prices. About a fifth fewer houses and a tenth fewer units changed hands than a year earlier, while median prices were a little higher. A sale needs a buyer and a seller, and these counts cannot say which side stepped back. On these figures the change so far is mostly in volume, not price.
First counts are low, and by different amounts. The ABS's first count of Sydney house sales has been raised by 11.9% to 22.9% in later releases, in each of the five quarters we checked. Last June's was the most complete: houses were raised 11.9% and units only 3.0%, against 13.8% to 22.9% for the others. Set this June's first count against last June's revised count and you see a fall of a third and a price fall too. Neither is a fair reading.
What happened after earlier falls in sales. On revised figures, the deepest fall since 2003 was in the September quarter of 2004 (−39.9%) and the most recent large one in the December quarter of 2022 (−36.3%). Within a year, the median's worst reading on a year earlier was −7.1% after the first and −5.7% after the second. Two episodes are not a rule.
Lending: a surge has unwound. New lending rose strongly in late 2025 and has fallen back since, investors' further than owner-occupiers'. Against a year earlier, both are about where they were.
How we measured
- ABS Total Value of Dwellings, six releases (June quarter 2024 to June quarter 2026), each quarter as first published and as later revised: Sydney medians and numbers of established houses and attached dwellings transferred, original series. The adjusted range raises this June's first count by each earlier quarter's revision, leaving out last June itself.
- ABS Lending Indicators, June quarter 2026: new loan commitments excluding refinancing, NSW, seasonally adjusted, in dollars.
- ABS Consumer Price Index, rents, Sydney, August 2026.
- A median is not an index: it moves with the mix of homes sold. These figures end on 30 June 2026, before the rate rise.
- This is one edition, published 5 October 2026, and is not updated. Its inputs are frozen with the checksum of every file read, and every ABS figure comes from a script that reads them.
Is your rent fair? Check it in a minute, and add yours to help others.
General information, not financial advice.
Sources
- Based on Australian Bureau of Statistics data: Total Value of Dwellings (6432.0), Lending Indicators (5601.0) and Consumer Price Index (6401.0), licensed under CC BY 4.0 (creativecommons.org/licenses/by/4.0).
- Rate decision: Reserve Bank of Australia, 29 September 2026. No endorsement by the Reserve Bank is implied.