
The Delta · Weekly · 5 – 11 October 2026
Distress in the headlines; bank arrears level with a year ago, but turning up
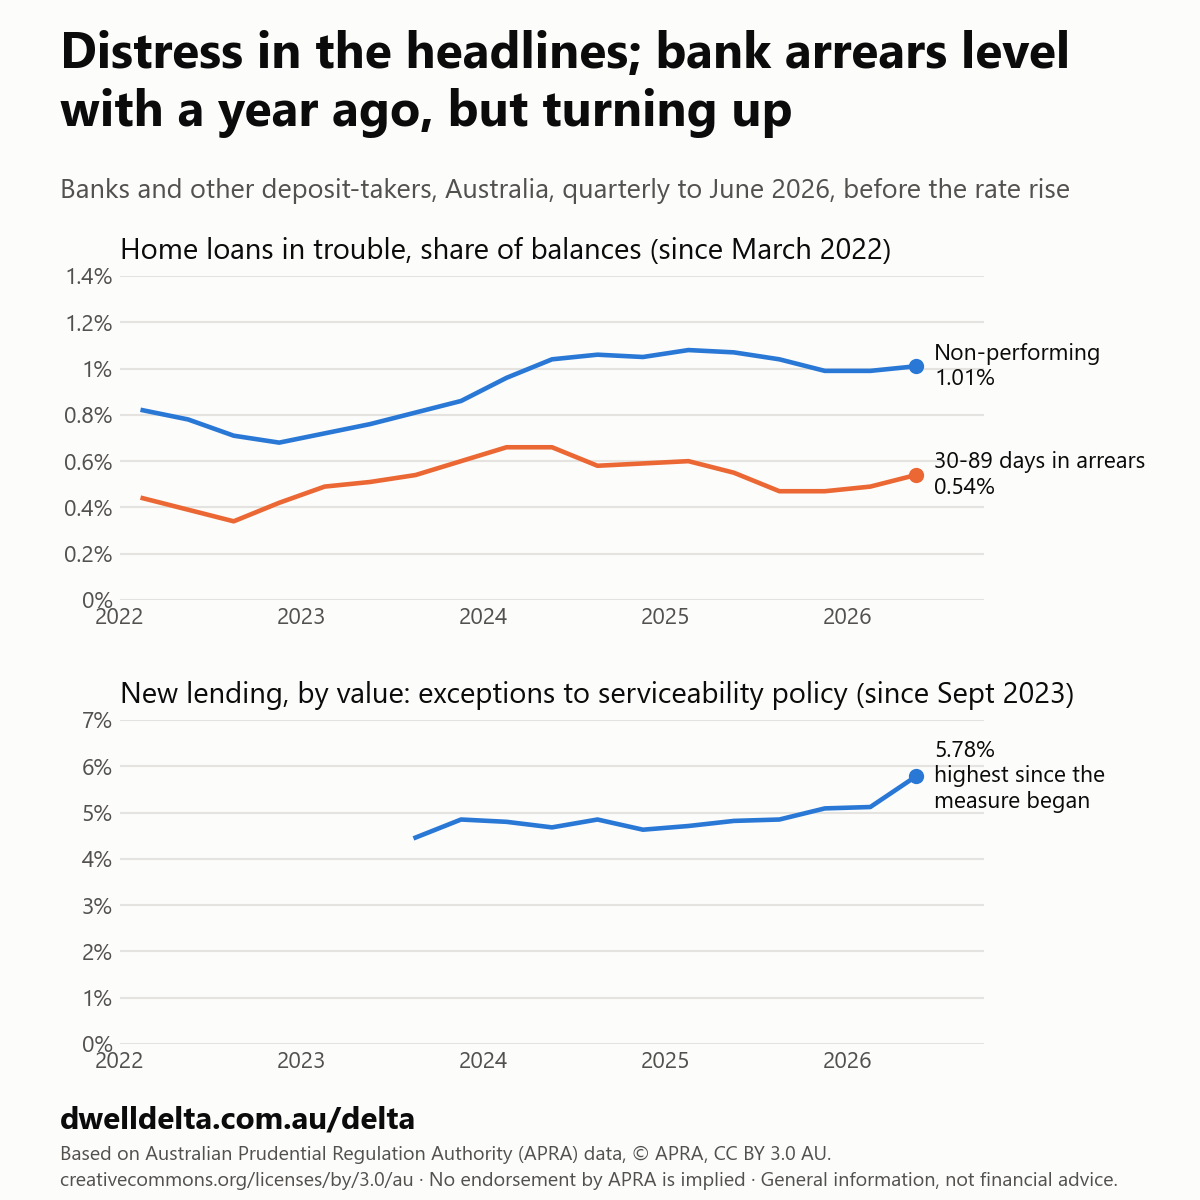
In the banks' own books, distress was no worse than a year earlier by June, though arrears had begun to rise: 0.54% of home-loan balances were 30 to 89 days in arrears, against 0.55% a year earlier, and 1.01% were non-performing, against 1.07%. What had risen was lending outside the banks' own serviceability policy: 5.78% of new lending by value was approved as an exception to the bank's own serviceability policy, the highest since that measure began in September 2023. All of this predates the 29 September rate rise.
What the headlines said
Fewer than half of the auctions held on 3 and 4 October sold, on preliminary figures, the weakest result since late June, and sellers under pressure were said to be mounting, as widely reported on 5 October. The same reports said values were nearing their sharpest fall in more than forty years. On 29 September the Reserve Bank lifted the cash rate to 4.60%.
What our data says
The headlines describe sellers. The banks report on borrowers: every quarter, the Australian Prudential Regulation Authority (APRA) publishes how much of the home lending of banks and other deposit-takers is behind, and how new loans are being written. Lenders outside the banking system, such as non-bank lenders and private credit funds, are not included. Its latest figures are for the June quarter, before the rate rise.
| Banks and other deposit-takers, Australia | June quarter 2026 | June quarter 2025 | Highest in the series (series start) |
|---|---|---|---|
| Home-loan balances 30-89 days in arrears | 0.54% | 0.55% | 0.66% (June quarter 2024); from March 2022 |
| Non-performing home-loan balances | 1.01% | 1.07% | 1.08% (March quarter 2025); from March 2022 |
| New lending approved as exceptions to serviceability policy | 5.78% | 4.82% | 5.78% (this quarter); from September 2023 |
| New term lending: interest-only | 23.62% | 20.75% | 23.62% (this quarter); from March 2019 |
| New term lending: 90% or more of the value | 7.79% | 6.55% | 11.34% (December quarter 2020); from March 2019 |
Unemployment, the usual bridge from higher rates to missed repayments, was 4.6% across Australia in August, up from 4.2% a year earlier, and 4.3% in NSW, up from 4.2%.
Where we differ
Distress in the headlines is not yet more distress in the banks' books. By June, 0.54% of home-loan balances were 30 to 89 days behind, about the same as a year earlier and below the 0.66% of mid-2024. Non-performing balances were 1.01%, slightly lower than a year before, though close to the 1.08% of early 2025. This is not evidence against the selling story: borrowers under pressure who still have equity can sell before they fall behind, so distressed selling need not show here, and lenders outside the banks are not counted.
But arrears have turned up. The 30-to-89-day share has risen for two quarters, from 0.47% to 0.54%, before the rate rise added to repayments. Unemployment across Australia rose from 4.3% in March to 4.6% in August, with a dip in May.
New lending loosened at the margin. In the June quarter, 5.78% of new lending by value was approved as an exception to the bank's own serviceability policy, up from 4.82% a year earlier and the highest since APRA began reporting the measure in this form in September 2023. The interest-only share of new term lending reached 23.62%, the highest in APRA's current series, which begins in March 2019. Neither share can say why it rose, or how risky these particular loans are. They were written before the rate rise; the September quarter's figures will be the first to show how they hold up.
How we measured
- APRA Quarterly Authorised Deposit-taking Institution Property Exposures, June quarter 2026: banks, building societies and credit unions (authorised deposit-taking institutions), Australia. Arrears and non-performing loans are shares of the value of home loans outstanding. Exceptions are a share of the value of all new loans funded in the quarter; the interest-only and 90% shares are of the value of new term loans.
- Each measure is compared only within APRA's current definition. Its asset-quality figures follow a new prudential standard from March 2022, so earlier readings are not comparable; and in September 2023 APRA split its measure of loans approved outside serviceability policy into two, so the exceptions figure starts there.
- Lenders outside the banking system, such as non-bank lenders and private credit funds, are not in these figures.
- ABS Labour Force, August 2025 and March to August 2026: unemployment rate, seasonally adjusted.
- The headline claims are quoted as reported; we reproduce no figure from those reports beyond the share of auctions that sold and the forty-year comparison.
- These figures end on 30 June 2026 (APRA) and 31 August 2026 (ABS), before the rate rise. APRA's September-quarter figures are due in December.
- This is one edition and is not updated. Its inputs are frozen with the checksum of every file read, and every figure comes from a script that reads them.
Is your rent fair? Check it in a minute, and add yours to help others.
General information, not financial advice.
Sources
- Based on Australian Prudential Regulation Authority (APRA) data: Quarterly Authorised Deposit-taking Institution Property Exposures, © Australian Prudential Regulation Authority, licensed under CC BY 3.0 AU (creativecommons.org/licenses/by/3.0/au). No endorsement by APRA is implied.
- Based on Australian Bureau of Statistics data: Labour Force (6202.0), licensed under CC BY 4.0 (creativecommons.org/licenses/by/4.0). No endorsement by the ABS is implied.
- Headlines: as widely reported on 5 October 2026 (found by web search; the reports were not read in full).
- Rate decision: Reserve Bank of Australia, 29 September 2026. No endorsement by the Reserve Bank is implied.