
The Delta · Weekly · 12 – 18 October 2026
Advertised rents have slowed, the reports say; what all tenants paid was still rising in August
What all tenants pay follows advertised rents by months, because most tenants are partway through a lease, so the gap between the two is what a lag would produce, not a contradiction. In the three months to August, what all tenants pay rose in each of the eight capitals, by 0.24% in Canberra to 1.99% in Darwin. What new tenants signed for was higher than a year earlier in each of the three states in this issue: in Queensland, general tenancies rose 6.3%, to $670 a week from $630.
What the headlines said
Advertised rents have slowed sharply, and on some measures stalled, it was reported in September and October. It was reported that advertised rents were flat nationally over the 30 days to 4 September, and that over the quarter to September they fell in Sydney alone of the capitals. Vacancies were reported up from their March low. These are measures of what the next tenant is asked.
What our data says
Two public records measure something else: what all tenants pay, and what new tenants signed for.
What all tenants pay. The Australian Bureau of Statistics (ABS) measures the rents of all tenancies, new and continuing, as an index:
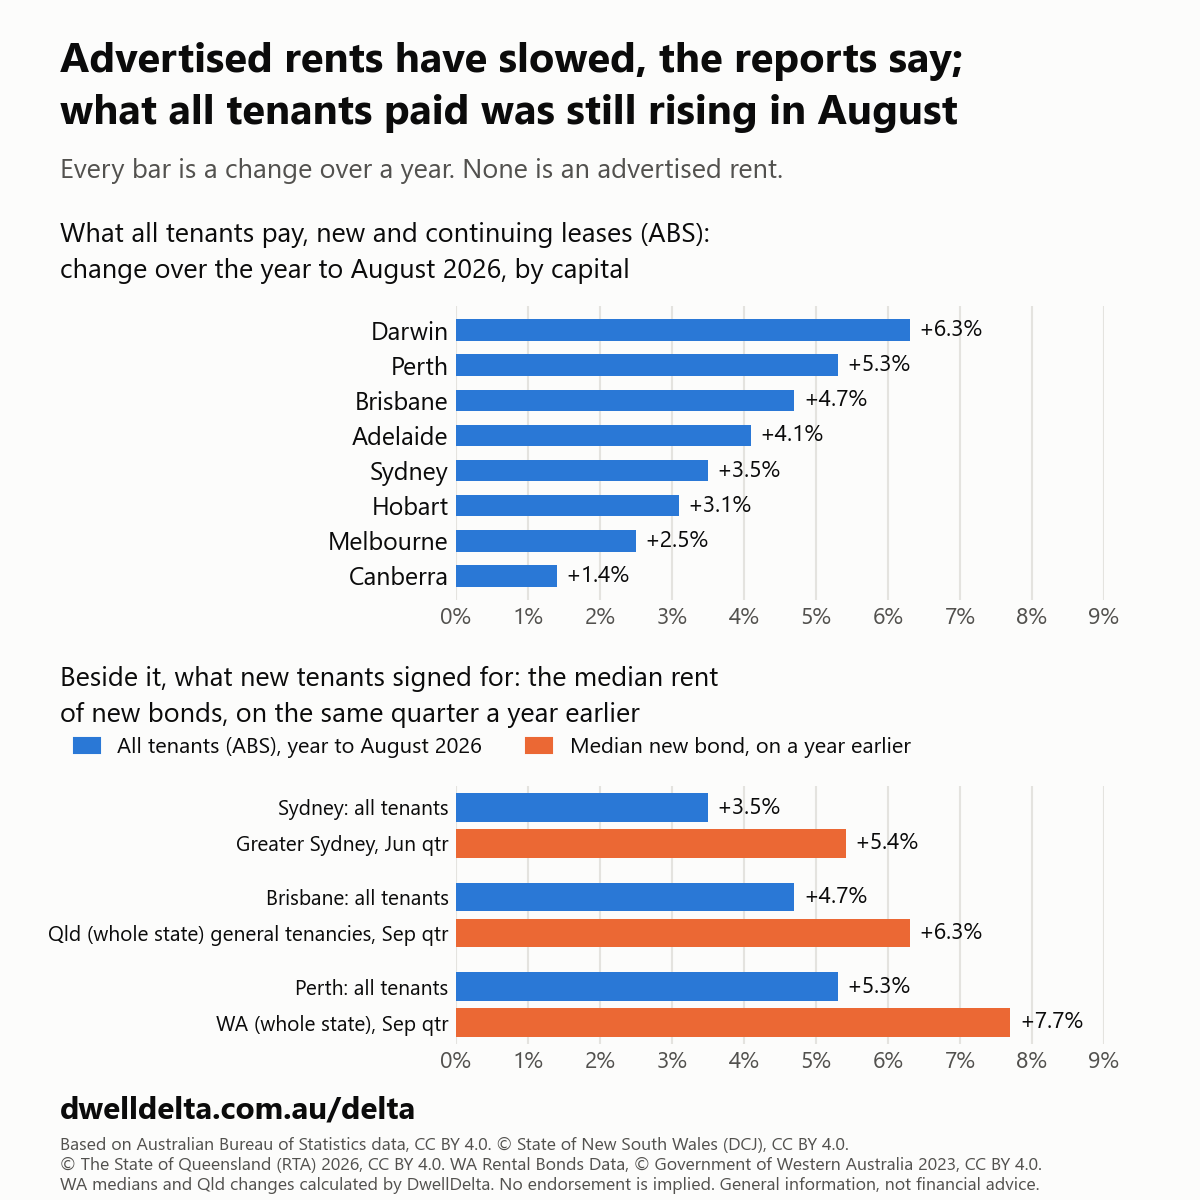
In the lower panel only the Sydney pair covers the same area: the Queensland and Western Australian bond medians are for the whole state, the ABS figures for the capital city only.
| Capital | August 2026 on July | Three months to August 2026 | Year to August 2026 | Highest annual rise in the series we hold, which starts in July 2023 |
|---|---|---|---|---|
| Sydney | +0.28% | +0.91% | +3.5% | +8.8% (March 2024) |
| Melbourne | +0.28% | +0.78% | +2.5% | +6.8% (March 2024) |
| Brisbane | +0.39% | +1.25% | +4.7% | +9.8% (August 2023) |
| Perth | +0.52% | +1.53% | +5.3% | +10.3% (August and October 2024) |
| Adelaide | +0.35% | +1.08% | +4.1% | +7.4% (August 2023) |
| Hobart | +0.27% | +0.88% | +3.1% | +3.1% (August 2026) |
| Darwin | +0.67% | +1.99% | +6.3% | +6.3% (August 2026) |
| Canberra | +0.10% | +0.24% | +1.4% | +3.9% (July 2023, the first month we hold) |
What new tenants signed for. When a bond is lodged with a state agency, the weekly rent is recorded with it. The median weekly rent of new bonds:
| Quarter | Median weekly rent | On the same quarter a year earlier | On the quarter before | New bonds | |
|---|---|---|---|---|---|
| NSW, all dwellings | June 2026 | $720 | +5.88% | 0.0% | 69,642 |
| Greater Sydney, all dwellings | June 2026 | $780 | +5.41% | 0.0% | 49,784 |
| Queensland, general tenancies | September 2026 | $670 | +6.3% | +3.1% | 52,552 |
| Queensland, all dwellings | September 2026 | $650 | +8.3% | 0.0% | 59,071 |
| Western Australia, all dwellings | September 2026 | $700 | +7.7% | not held | 19,896 |
A median of new bonds moves with the mix of homes let in the quarter, and with the season, and in steps: it is not a like-for-like measure. In Queensland, general tenancies, which leave out rooming accommodation, rose 6.3% on a year earlier, to $670 from $630. The all-dwellings median rose 8.3%, more than either of its parts (general tenancies +6.3%, rooming accommodation +7.0%): a median of the whole is not an average of its parts' medians, and it moves with the mix of homes let.
Of the areas with 30 or more new bonds in the latest quarter (in NSW, more than 30) and a median a year earlier, how many had a higher median than a year earlier:
| Quarter | Areas | Higher | Lower | No change | |
|---|---|---|---|---|---|
| NSW postcodes, more than 30 new bonds | June 2026 | 347 | 298 | 24 | 25 |
| Queensland suburbs, all dwellings, 30 or more new bonds | September 2026 | 479 | 408 | 46 | 25 |
| Western Australia localities, 30 or more new bonds | September 2026 | 191 | 170 | 9 | 12 |
Where we differ
What all tenants pay follows advertised rents by months. What all tenants pay rose in August in every capital, by 0.10% in Canberra to 0.67% in Darwin, and over the three months to August by 0.24% to 1.99%. This is not evidence against the headlines: the index moves mainly as each tenancy's rent is reset, at a renewal or a new lease, so it follows advertised rents by months. The gap is what a lag would produce, not a contradiction. The ABS's September figures are due on 28 October.
In Darwin, what all tenants pay rose fastest of the eight capitals. Darwin's annual rise in August was 6.3%, the fastest of the eight capitals and the highest in the series we hold, which starts in July 2023, and higher than in July to September 2023, before the Rent Assistance increases (at most 5.8%). Hobart's 3.1% was also the highest in that series, which for Hobart includes 23 months, October 2023 to August 2025, when the annual change was below zero. In Sydney, Melbourne, Brisbane, Perth, Adelaide and Canberra it was well under its highest.
On the quarter, the medians of new bonds were flat or rising, but a median is not like-for-like. The median new bond was unchanged in NSW and in Greater Sydney in June on March. In Queensland, general tenancies rose to $670 in September from $650 in June, as the September median usually does: it was higher than June's in 10 of the 14 years from 2012 to 2025, and lower in none. The all-dwellings median, which moves with the mix of homes let, was $650 in both. Our bond figures end in June for NSW and in September for Queensland and Western Australia; the reports are about August and September.
How we measured
- New bonds: the median weekly rent of bonds lodged in the quarter. NSW and Greater Sydney: Department of Communities and Justice, Rent and Sales Report, June quarter 2026, all dwellings; the file we hold gives the changes, not the earlier medians. Queensland: Residential Tenancies Authority, median rents, September quarter 2026, general tenancies and all dwellings; our extract of the RTA's workbook keeps each dwelling type for the latest quarter and a year earlier, and all dwellings and general tenancies for every quarter from March 2012. Western Australia: medians of all dwellings calculated by DwellDelta from the state's rental bond records, for the latest quarter and the same quarter a year earlier only, so there is no change on the quarter before.
- Areas: NSW postcodes for which the Department publishes the count of new bonds (it does so for more than 30 in the quarter); Queensland suburbs and Western Australia localities with 30 or more new bonds in the latest quarter. Each is counted only with a median a year earlier, which rests on each publisher's own minimum (for Western Australia, ours: 10 bonds). An area is "higher" when its median is higher than in the same quarter a year earlier.
- What tenants pay: ABS Consumer Price Index, rents, monthly, by capital city, to August 2026. The index covers all tenancies, new and continuing, and includes public and community housing. It is measured net of Commonwealth Rent Assistance, which is indexed each March and September. The increases of September 2023 and September 2024, which also raised the maximum rates by 15% and 10%, lowered the index when they took effect: it fell in October in seven of the eight capitals in both years, against none in 2022 and one in 2025. The index moves mainly as each tenancy's rent is reset, at a renewal or a new lease. The monthly figures are original, not seasonally adjusted. Annual changes begin in July 2023 in the series we hold, so "highest" means since then. The September figures are due on 28 October (ABS release calendar, read on 19 October).
- Advertised-rent figures belong to their publishers, and we reproduce none of them: the claims are reported by their direction only. The reports are cited by date, not named, because DwellDelta names only sources it can use commercially. They were found by web search and were not read in full.
- Victoria's bond figures are not included: the newest state file we hold is a year old.
- This is one edition and is not updated. Its inputs are frozen with the checksum of every extract read, and every figure from the four records comes from a script that reads them.
Is your rent fair? Check it in a minute, and add yours to help others.
General information, not financial advice.
Sources
- Based on Australian Bureau of Statistics data: Consumer Price Index (6401.0), rents by capital city, monthly, licensed under CC BY 4.0 (creativecommons.org/licenses/by/4.0). No endorsement by the ABS is implied.
- © State of New South Wales (Department of Communities and Justice), Rent and Sales Report No. 156, rent tables, June 2026 quarter (extracted on 31 July 2026). Licensed under CC BY 4.0 (creativecommons.org/licenses/by/4.0): dcj.nsw.gov.au/statements/copyright-and-disclaimer.html. The medians and changes are the Department's; the counts of postcodes are calculated by DwellDelta from them. No endorsement by the Department is implied.
- © The State of Queensland (Residential Tenancies Authority) 2026, median rents quarterly data, September 2026 quarter. Licensed under CC BY 4.0, as the workbook states (creativecommons.org/licenses/by/4.0); the RTA's copyright page gives CC BY 3.0 AU for its material generally (rta.qld.gov.au/copyright). The changes and the counts of suburbs are calculated by DwellDelta from the RTA's medians. No endorsement by the RTA is implied.
- Based on WA Rental Bonds Data, © Government of Western Australia (Department of Mines, Industry Regulation and Safety) 2023, licensed under CC BY 4.0 (creativecommons.org/licenses/by/4.0). Medians calculated by DwellDelta from the bond records; they are not the Government's figures. No endorsement by the Government of Western Australia is implied.
- Rent Assistance increases: ABS, Monthly Consumer Price Index Indicator, September and October 2023 and 2024 (read on 19 October 2026).
- Headlines: as reported in September and October 2026, cited by date and not named, because DwellDelta names only sources it can use commercially.
- The headline reports were found by web search on 2026-10-13 and 2026-10-19 and were not read in full.