
The Delta · Weekly · 19 – 25 October 2026
Not enough homes are being built, the reports say; NSW completed 15.6% more homes over four quarters, still a third fewer than at its 2018 peak
On the ABS's first estimate, seasonally adjusted, NSW completed 13,332 homes in the June quarter, 43.5% more than a year earlier; but June 2025 was its weakest quarter in more than a decade. Over the four quarters to June, NSW completed 49,303 homes, 15.6% more than in the four quarters before and 5.8% more than two years earlier, and a third fewer than at the 2018 peak. Population growth slowed, and it slowed a year ago: in the year to March 2026, NSW added 2.14 people for each home completed, about the same as the 2.11 of the year before, and down from 3.46 two years earlier, the highest of any year from 2015.
What the headlines said
Two years into the national target for new homes, the homes completed are well behind it, and the target is slipping away, it was reported on 7 October 2026, the day the ABS published its June-quarter building figures. NSW had been reported in July to be falling short of its own target. The common reading: Australia is not building enough homes.
What our data says
Three ABS records bear on the question: homes completed, homes approved, and the population they are for. All three are by state. Approvals are held for NSW, Victoria and Queensland, so those three are covered in full; for Western Australia and South Australia, this issue gives completions and population only.
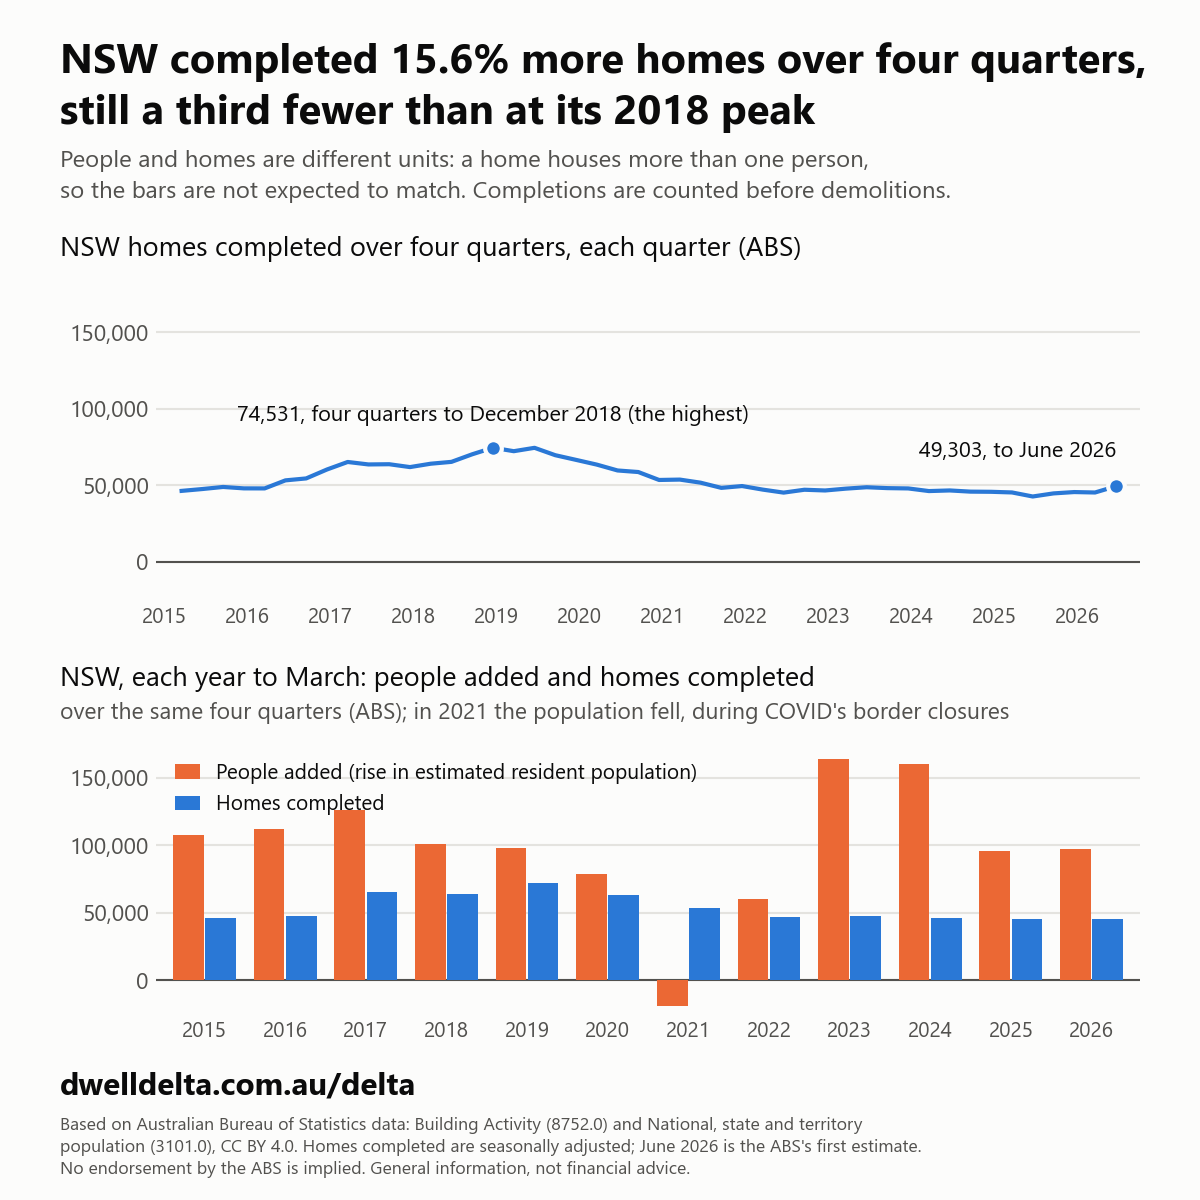
Homes completed. NSW stands out: 13,332 homes completed in the June quarter, 43.5% more than a year earlier. This is the ABS's first estimate for the quarter, seasonally adjusted, resting on responses covering about 85% of the value of building work done, below the long-term average, and it will be revised in January. The quarter a year earlier, June 2025, was NSW's weakest in more than a decade in the ABS's current figures, at 9,291 (the last as low was September 2013). Against June 2024, 11,937, the June quarter was 11.7% higher. Over four quarters, which takes out much of the quarter-to-quarter swing, the rise is smaller:
| Homes completed, seasonally adjusted | June quarter 2026 | On June quarter 2025 | Four quarters to June 2026 | On the four quarters to June 2025 | On the four quarters to June 2024 | Highest four quarters in the series, from 1984 |
|---|---|---|---|---|---|---|
| NSW | 13,332 | +43.5% | 49,303 | +15.6% | +5.8% | 74,531 (to December 2018) |
| Victoria | 14,191 | +11.1% | 56,303 | 0.0% | -7.7% | 69,972 (to September 2017) |
| Queensland | 9,549 | +20.8% | 34,778 | +2.5% | +5.6% | 50,532 (to March 1995) |
NSW's 49,303 is the most in any financial year since 2020-21 (51,680). Its quarters have see-sawed: 9,291 in June 2025, 13,351 in September, 12,346 in December, 10,274 in March and 13,332 in June. Over the four quarters to September, December and March, completions were flat, at 44,672, 45,549 and 45,262. The four quarters to June were 4,041 higher than the four to March because June 2026's 13,332 replaced June 2025's 9,291.
In Western Australia, completions in the four quarters to June fell 12.9%, to 19,638 from 22,551. In South Australia they rose 6.6%, to 13,738.
Homes approved, over three and twelve months, on the same months a year earlier.
| Homes approved, seasonally adjusted | June to August 2026 | June to August 2025 | Change | Twelve months to August 2026 | Twelve months to August 2025 | Change |
|---|---|---|---|---|---|---|
| NSW | 13,570 | 12,578 | +7.9% | 53,525 | 49,909 | +7.2% |
| Victoria | 14,150 | 12,976 | +9.0% | 57,105 | 56,154 | +1.7% |
| Queensland | 12,520 | 11,346 | +10.3% | 47,500 | 40,086 | +18.5% |
In the four quarters to June 2026, NSW approved 1.07 homes for each one it completed, Victoria 0.99 and Queensland 1.37. These are two counts over the same months, not approvals set against the homes they became: a home approved now is finished a year or more later, if at all.
The population the homes are for. In each year to March, the rise in NSW's estimated resident population, and the homes completed in NSW over the same four quarters:
| NSW, year to March | People added | Homes completed | People added for each home completed |
|---|---|---|---|
| 2015 | 107,897 | 46,317 | 2.33 |
| 2016 | 111,681 | 47,930 | 2.33 |
| 2017 | 126,051 | 65,214 | 1.93 |
| 2018 | 101,225 | 64,077 | 1.58 |
| 2019 | 98,303 | 72,257 | 1.36 |
| 2020 | 79,010 | 63,494 | 1.24 |
| 2021 | -18,986 | 53,700 | -0.35 |
| 2022 | 60,188 | 47,139 | 1.28 |
| 2023 | 164,126 | 47,783 | 3.43 |
| 2024 | 160,072 | 46,197 | 3.46 |
| 2025 | 95,733 | 45,297 | 2.11 |
| 2026 | 96,971 | 45,262 | 2.14 |
NSW's population fell in the year to March 2021, during COVID's border closures.
| People added for each home completed, year to March | 2024 | 2025 | 2026 |
|---|---|---|---|
| Victoria | 3.02 | 1.92 | 1.99 |
| Queensland | 3.92 | 2.97 | 2.72 |
| Western Australia | 5.37 | 3.17 | 3.19 |
| South Australia | 2.54 | 1.63 | 1.29 |
Where we differ
The 43.5% owes much to a weak quarter a year earlier. NSW's June-quarter rise is the seventh-largest of the 164 quarters' changes on a year earlier since September 1985, and eight quarters in that history, this one among them, show a rise of 40% or more. Over four quarters, NSW completed 15.6% more homes than a year earlier (the four quarters to June 2025 were NSW's fewest since the four to September 2014), and 5.8% more than in the four quarters to June 2024: up, but a third (33.8%) below the four quarters to December 2018. One quarter does not make a trend; the September quarter, due in January, will say more.
What slowed was population growth, not the building. NSW completed about the same number of homes in each of the years to March 2024, 2025 and 2026: 46,197, 45,297 and 45,262. Its population grew by 160,072, 95,733 and 96,971. So the people added for each home completed fell from 3.46, the highest of any year from 2015, to 2.11 a year later, and was about the same, 2.14, in the year to March 2026. Population growth was slower in both of the last two years than in the two before. The ratio is back near the 2.33 of 2015 and 2016, and above the 1.24 to 1.58 of the years to March 2018 to 2020, around the series' peak in completions.
The two slower years follow two in which NSW added 3.43 and 3.46 people for each home completed. The measure has limits: completions are counted before demolitions are taken off; the population estimate includes people who do not live in private homes, such as those in student halls, hostels and aged care; and the ratio says nothing of how many people share a home, or of whether enough homes were built.
Elsewhere, too, the ratio fell over two years. In Victoria, people added for each home completed fell from 3.02 to 1.99 over the two years to March 2026; in Queensland, from 3.92 to 2.72. In the latest year, Victoria's ratio rose, from 1.92 to 1.99, as its completions fell 9.2%. In South Australia the ratio fell, from 2.54 to 1.29, as completions rose, by 11.5% in the year to March 2025 and 17.7% in the year to March 2026. Western Australia's fell from 5.37 to 3.17 in the year to March 2025, as its completions rose 24.6%, then rose slightly, to 3.19, in the latest year, as they fell 8.0%. Tasmania, the ACT and the Northern Territory are not covered.
Approvals were higher than a year earlier, over three months and over twelve, in all three states. In the three months to August, NSW approved 7.9% more homes than in the same months a year earlier, Victoria 9.0% more and Queensland 10.3% more. Over the twelve months to August, the rises were 7.2%, 1.7% and 18.5%.
How we measured
- Homes completed: ABS Building Activity, Australia (8752.0), June quarter 2026 (released 7 October 2026), dwelling units completed by state, all types of building and all types of work, private and public sector, seasonally adjusted. These are homes finished, including those created by alterations and conversions; homes demolished are not subtracted. The ABS notes that the June-quarter figures rest on responses covering about 85% of the value of building work done in the quarter, below the long-term average, and that final figures for the quarter will be released on 13 January 2027. Seasonally adjusted figures are revised with each release, so earlier quarters may differ from those first published.
- Four-quarter totals are the sum of four seasonally adjusted quarters, each compared with the four quarters ending a year (or two years) earlier. A financial year is the four quarters to June. "Highest" is the highest four-quarter total in the series, which starts in September 1984.
- Homes approved: ABS Building Approvals, Australia (8731.0), August 2026 (released 30 September 2026), total dwelling units approved by state, seasonally adjusted. Three-month and twelve-month totals are sums of months, each compared with the same months a year earlier. The September figures are due on 2 November 2026.
- Population: ABS National, state and territory population (3101.0), March quarter 2026 (released 17 September 2026), estimated resident population by state. The change over four quarters to March is set against the homes completed in the same four quarters. The latest estimates are preliminary and will be revised, and, as after each Census, the estimates will be rebased to the 2026 Census. The June-quarter figures are due on 17 December 2026.
- The reports are cited by date and direction only, not named, because DwellDelta names only sources it can use commercially. They were found by web search and were not read in full, and we reproduce no figure from them.
- This is one edition and is not updated. Its inputs are frozen with the checksum of every extract read, and every figure from the three records comes from a script that reads them.
Is your rent fair? Check it in a minute, and add yours to help others.
General information, not financial advice.
Sources
- Based on Australian Bureau of Statistics data: Building Activity (8752.0), dwelling units completed by state, quarterly, seasonally adjusted, licensed under CC BY 4.0 (creativecommons.org/licenses/by/4.0). No endorsement by the ABS is implied.
- Based on Australian Bureau of Statistics data: Building Approvals (8731.0), total dwelling units approved by state, monthly, seasonally adjusted, licensed under CC BY 4.0 (creativecommons.org/licenses/by/4.0). No endorsement by the ABS is implied.
- Based on Australian Bureau of Statistics data: National, state and territory population (3101.0), estimated resident population by state, quarterly, licensed under CC BY 4.0 (creativecommons.org/licenses/by/4.0). No endorsement by the ABS is implied.
- Release dates, the June-quarter response note and the revision date: the ABS release pages for Building Activity, Building Approvals and National, state and territory population (read through the gate on 20 October 2026).
- Headlines: as reported in July and October 2026, cited by date and not named, because DwellDelta names only sources it can use commercially.
- The headline reports were found by web search on 2026-10-20 and were not read in full.