
The Delta · Weekly · 26 October – 1 November 2026
Advertised rents are slowing, the reports say; what all tenants paid rose in September, in every capital
In September it rose on August in each of the eight capitals, by 0.06% in Canberra to 0.49% in Darwin. For the eight capitals together, the ABS says its rise over a year was 3.6% to September, against 3.8% a year earlier, and has been 3.6% since May: slower, as the reports say of advertised rents. Over the year to September it rose faster than over the year to August in three capitals, more slowly in four and at the same rate, to two decimals, in one. Half of these differences are a few hundredths of a point; only Hobart's and Darwin's exceed a tenth. Its private-rental part moves as leases are renewed or begin, so a change in advertised rents reaches it months later; this issue makes no forecast of when.
What the headlines said
Advertised rents were reported in October to be growing more slowly, with unit rents falling and house rents still rising in most capitals over the 30 days to mid October, and vacancies higher. A quarterly report had house rents flat and unit rents a little higher across the capitals combined over the September quarter, a longer window ending earlier: the reports differ on houses and units. A record median advertised rent for September was also reported: a rent at a record can still be growing more slowly. The September quarter's consumer price figures, released by the ABS on 28 October, were reported as what decides the cash rate on 3 November. The ABS's headline inflation was faster in the year to September than in the year to August, and was reported as faster than one bank's preview had expected. Markets were reported as pricing a rise on 3 November as the more probable outcome, and the four major banks as split, two expecting a rise and two a hold. The ABS named new dwellings, electricity and rents as the main contributors to housing's rise over the year. The advertised-rent reports measure the market for the next tenant; the consumer price figures include the ABS's measure of what all tenants pay, which is the one read below.
The common reading: inflation is rising again and a rise in the cash rate on 3 November is more probable; rents are slowing, so they are adding less to it.
What our data says
The Australian Bureau of Statistics (ABS) measures what all tenants pay, after Commonwealth Rent Assistance, new and continuing leases together, as an index, each month, for each capital city. Two questions, kept apart: did what tenants pay keep rising, and did its rise over a year speed up? The first is the month on the month before. The second is the same month set beside the same month a year earlier: the annual rise went up when the month's rise was larger than a year earlier, before either is rounded.
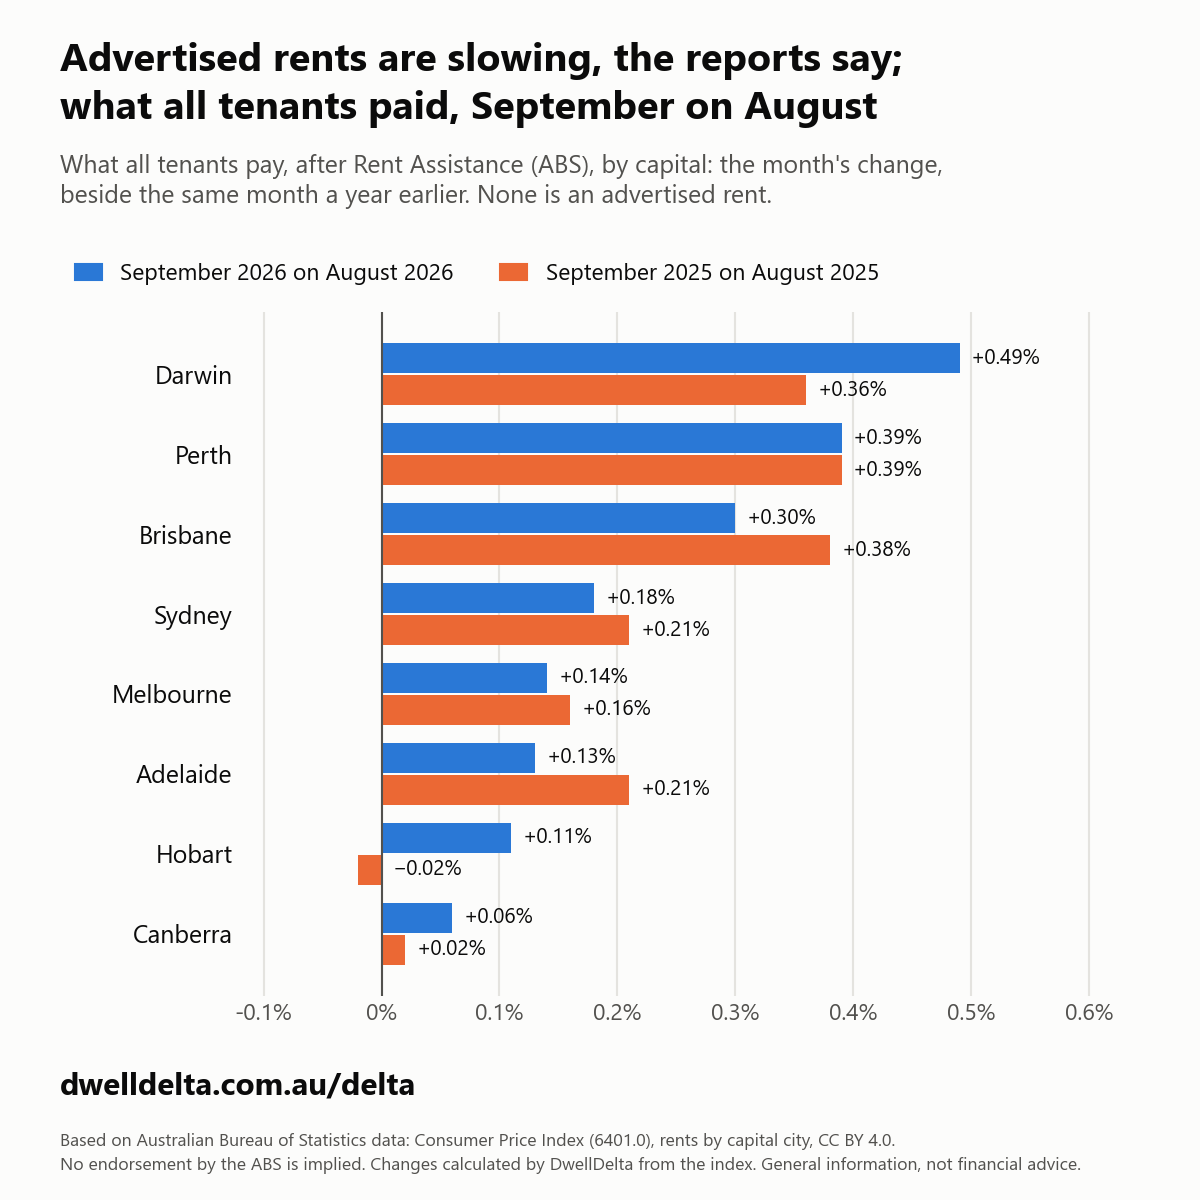
| Capital | September 2026 on August 2026 | September 2025 on August 2025 | Year to September 2026 | Year to August 2026 | The rise over a year, to two decimals |
|---|---|---|---|---|---|
| Sydney | +0.18% | +0.21% | +3.48% | +3.51% | slower |
| Melbourne | +0.14% | +0.16% | +2.47% | +2.49% | slower |
| Brisbane | +0.30% | +0.38% | +4.58% | +4.67% | slower |
| Perth | +0.39% | +0.39% | +5.31% | +5.31% | the same |
| Adelaide | +0.13% | +0.21% | +4.00% | +4.08% | slower |
| Hobart | +0.11% | −0.02% | +3.19% | +3.06% | faster |
| Darwin | +0.49% | +0.36% | +6.48% | +6.34% | faster |
| Canberra | +0.06% | +0.02% | +1.40% | +1.36% | faster |
Over three months, against the same three months a year earlier, and the highest annual rise in the series we hold:
| Capital | Three months to September 2026 | Three months to September 2025 | Highest annual rise in the series we hold, which starts in July 2023 |
|---|---|---|---|
| Sydney | +0.80% | +0.78% | +8.82% (March 2024) |
| Melbourne | +0.68% | +0.77% | +6.79% (March 2024) |
| Brisbane | +1.16% | +1.18% | +9.82% (August 2023) |
| Perth | +1.45% | +1.45% | +10.33% (October 2024) |
| Adelaide | +0.87% | +1.01% | +7.39% (August 2023) |
| Hobart | +0.66% | +0.31% | +3.19% (September 2026) |
| Darwin | +1.97% | +1.10% | +6.48% (September 2026) |
| Canberra | +0.23% | +0.17% | +3.91% (July 2023, the first month we hold) |
Where we differ
Over a year, what all tenants pay is slowing too. For the eight capitals together, the ABS says its rise over a year was 3.6% to September, against 3.8% a year earlier, and has been 3.6% since May. Over a year, the ABS's figure for the eight capitals agrees with the reports on the direction, but it has not slowed since May. The year to September 2025 includes October 2024, when the 2024 Rent Assistance increase lowered the index in seven capitals, so the two figures understate the slowing rather than overstate it. Capital by capital, over the year to September against the year to September 2025, it rose faster in Sydney, Hobart, Darwin and Canberra, and more slowly in Melbourne, Brisbane, Perth and Adelaide. Had each capital's October 2024 moved as its October 2025 did, Sydney too would have risen more slowly: three faster and five slower. The ABS's figure for the eight capitals weights each capital by what its households spend on rent; this count does not.
What differs is the measure. The reports measure the rent asked of the next tenant. This index is what all tenants pay, most of them partway through a lease, and it includes public and community housing. It has no split by houses and units, so it neither confirms nor contradicts the reports that unit rents are falling. Its private-rental part moves as leases are renewed or begin, so a change in advertised rents reaches it months later; this issue makes no forecast of when.
Month by month, it rose in every capital. In September it rose on August in every capital, by 0.06% in Canberra to 0.49% in Darwin. The 30-day reports said unit rents fell, not rents overall; a rise in the level does not contradict a slowing. September is a month in which Rent Assistance is indexed, and so was the month it is set beside. In September 2025 it rose on August in seven of the eight capitals, by 0.02% in Canberra to 0.39% in Perth, and fell 0.02% in Hobart.
Its rise over a year, against August's, was faster in three capitals, slower in four and the same, to two decimals, in one. Over the year to September it rose faster than over the year to August in Hobart, Darwin and Canberra, more slowly in Sydney, Melbourne, Brisbane and Adelaide, and at the same rate, to two decimals, in Perth. In Perth, where it was the same to two decimals, it was a little slower before rounding. The count is of capitals, not of tenants: each capital counts once, whatever its size. The three where it was faster are the three smallest capitals; the four where it was slower include the three largest, Sydney, Melbourne and Brisbane. Where a capital's month differs from the same month a year earlier by a few hundredths of a point, the difference cannot be told apart from rounding, or, in a month with a Rent Assistance indexation, from the size of the indexation. Only in Hobart and Darwin, by more than a tenth of a point, is the gap clearly larger than that; in Brisbane and Adelaide, by less than a tenth, it may be; in Sydney, Melbourne, Perth and Canberra it is a few hundredths. Over the three months to September the rise was larger than over the same three months of 2025 in four capitals, smaller in three and the same, to two decimals, in one. In Perth, where the three months were the same to two decimals, they were a little larger before rounding.
In Darwin and Hobart the annual rise is the highest in the series we hold, which starts in July 2023. Darwin's 6.48% and Hobart's 3.19% are the highest since July 2023, where our series of annual changes starts. The annual changes from September 2023 to September 2025 were lowered by the Rent Assistance increases of 2023 and 2024; before them, in July and August 2023, Darwin's was at most 5.82% and Hobart's at most 2.56%. In the other six capitals it is well under its highest.
How we measured
- What tenants pay: ABS Consumer Price Index, rents, monthly, by capital city, to September 2026, original, not seasonally adjusted. The index covers all tenancies, new and continuing, and includes public and community housing. It moves mainly as each tenancy's rent is reset, at a renewal or a new lease. It has no split by houses and units, so it neither confirms nor contradicts the reports on units.
- Every change is calculated by DwellDelta from the index, which the ABS gives to two decimals, and is printed to two decimals. "The same, to two decimals" means the change over a year rounds to the same figure in both months, so a pair of monthly changes can differ by 0.01 and the rise over a year still be the same. The figures for the eight capitals together (3.6%, 3.8%, 0.2%, 0.3%) are the ABS's own, to one decimal, not DwellDelta's. The 3.6%, 3.8% and 0.2% are in Table 3 of the ABS's September 2026 release, its rents index for the eight capitals together; the table DwellDelta loads, Table 10, has the capitals only. The 0.3% is from the ABS's text.
- Matched windows only: a month against the same month a year earlier, three months against the same three months, a year against the year before it. The index is measured net of Commonwealth Rent Assistance, which is indexed each 20 March and 20 September, so each indexation lowers it in the month it takes effect and, in the series we hold, in the month after. The ABS says the usual biannual indexation occurred on 20 September 2026, and that without it rents for the eight capitals together would have risen 0.3% in September, not 0.2%; it said the usual biannual indexation occurred on 20 September 2025 too, and gave no figure without it. The increases of September 2023 and September 2024, which also raised the maximum rates, lowered it more: it fell in October in seven of the eight capitals in both years. The index is 100.00 in September 2025 in every capital.
- Annual changes begin in July 2023 in the series we hold, so "highest" means since then; the annual changes from September 2023 to September 2025 were lowered by the Rent Assistance increases of 2023 and 2024.
- Advertised-rent figures belong to their publishers, and we reproduce none of them: the claims are reported by their direction only. The reports are cited by date, not named, because DwellDelta names only sources it can use commercially. They were found by web search and were not read in full.
- This is one edition and is not updated. Its inputs are frozen with the checksum of the extract read, and every figure comes from a script that reads it. The ABS's October figures are due on 25 November 2026.
Is your rent fair? Check it in a minute, and add yours to help others.
General information, not financial advice.
Sources
- Based on Australian Bureau of Statistics data: Consumer Price Index (6401.0), rents by capital city, monthly, licensed under CC BY 4.0 (creativecommons.org/licenses/by/4.0). The changes are calculated by DwellDelta from the index. No endorsement by the ABS is implied.
- The eight capitals together (Table 3), headline inflation, housing's rise, and the indexation of September 2026: ABS, Consumer Price Index, Australia, September 2026 (released 28 October 2026, read on 28 and 29 October 2026).
- The indexation of September 2025: ABS, Monthly Consumer Price Index Indicator, September 2025 (released 29 October 2025, read on 28 October 2026).
- Rent Assistance increases: ABS, Monthly Consumer Price Index Indicator, September and October 2023 and 2024 (read on 19 October 2026).
- Headlines: as reported in October 2026, cited by date and not named, because DwellDelta names only sources it can use commercially.
- The headline reports were found by web search on 2026-10-20, 2026-10-27 and 2026-10-28 and were not read in full.