
The Delta · Weekly · 16 – 22 November 2026
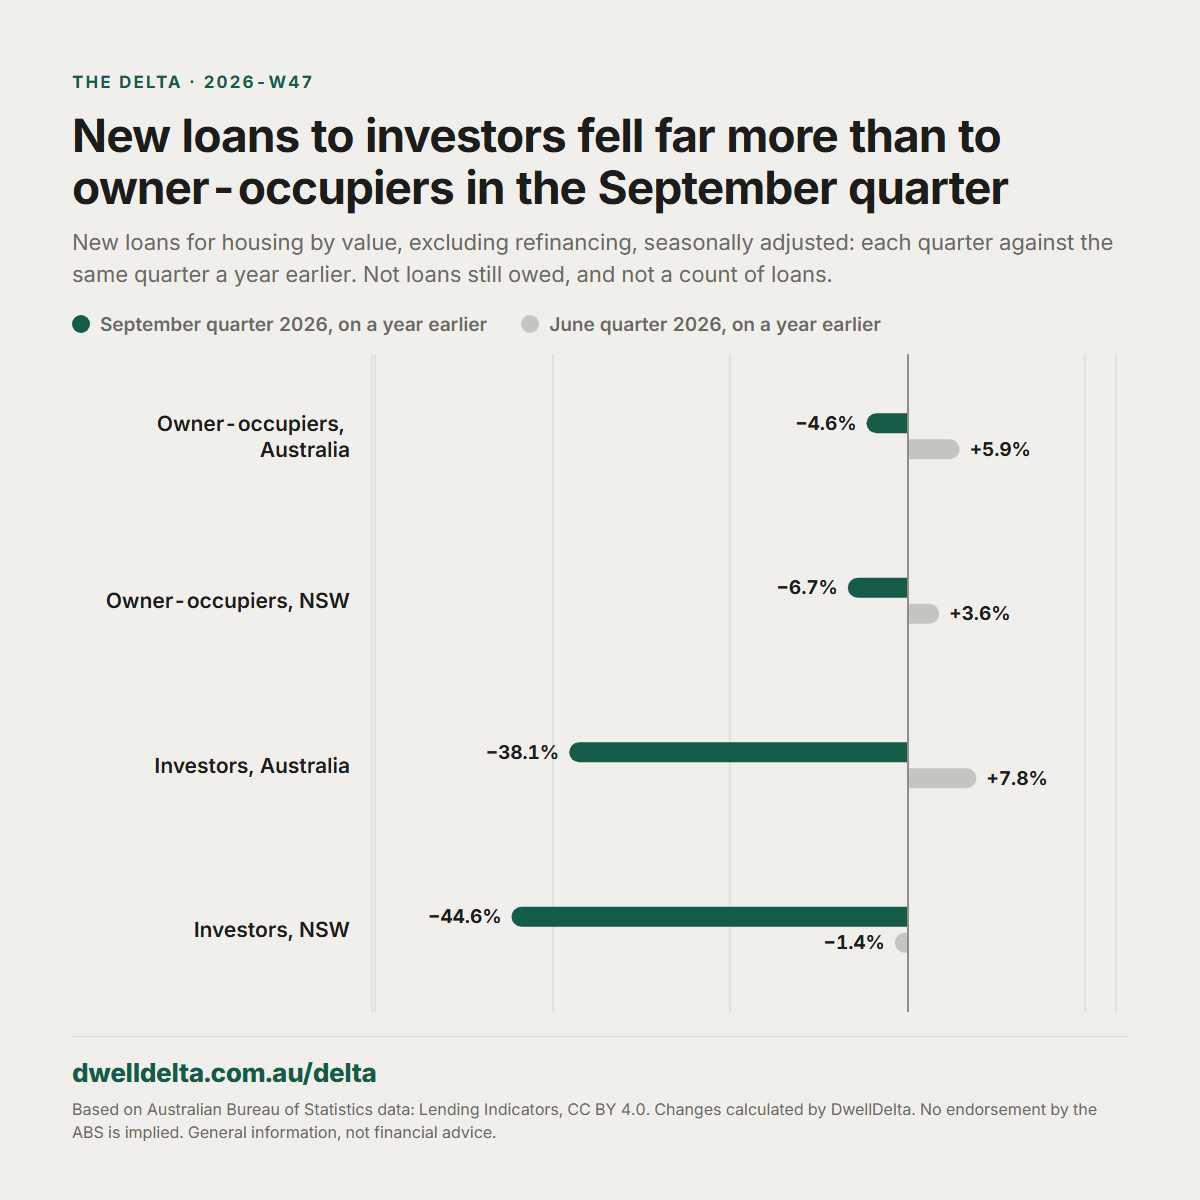
New loans to investors fell 38.1% on a year earlier in the September quarter; to owner-occupiers, 4.6%
Across Australia, new loans to investors in the September quarter were 38.1% below a year earlier, the deepest fall on a year earlier since our series allows the comparison, from 2003; new loans to owner-occupiers were 4.6% below a year earlier. By value, investors made up more than four-fifths of the fall in new lending for housing on a year earlier. Part of the investor fall is a high base: a year earlier their lending had jumped to what was then the highest in the series. Against two years earlier it is 26.4% lower. These are new loans by value, and they cannot say why lending to investors fell.
There was no issue for the week of 9 to 15 November.
What the headlines said
On 17 November the minutes of the 3 November cash-rate decision were reported. As reported, they said housing turnover had slowed sharply, and housing prices and lending for new housing had declined quite sharply. The decline in lending for new housing was said to have been pronounced for investors, in part reflecting recent tax changes. Housing-loan arrears were reported to be low. We read "lending for new housing" as new loans for housing of every kind, the measure below, and not only loans for newly built homes; the reports we found do not say which.
On 15 and 16 November the share of the weekend's auctions that sold was reported at its lowest since April 2020, on preliminary figures. On 13 November capital-city home values were reported to be falling faster than in at least 40 years. On 11 and 12 November the figures below were first reported, and the fall in new loans to investors was reported as the largest on record. Those reports compared the September quarter with the June quarter. The changes below compare it with the same quarter a year earlier, unless they say otherwise.
The common reading: new lending for housing has fallen sharply, most of all for investors.
What our data says
Every quarter, the ABS's Lending Indicators give the value of new loans for housing that lenders committed to in the quarter, investor and owner-occupier, by state, seasonally adjusted. Refinancing is left out. These are new loans, not loans still owed: 2026-w45 read the loans still owed, in the banks' books. The latest quarter is the September quarter 2026, July to September.
| New loans for housing, September quarter | 2026 | 2025 | On a year earlier | On two years earlier |
|---|---|---|---|---|
| Investors, Australia | $24.7 billion | $39.9 billion | −38.1% | −26.4% |
| Owner-occupiers, Australia | $56.5 billion | $59.2 billion | −4.6% | +4.5% |
| Investors and owner-occupiers summed, Australia | $81.2 billion | $99.1 billion | −18.1% | −7.3% |
| Investors, NSW | $8.6 billion | $15.5 billion | −44.6% | −32.3% |
| Owner-occupiers, NSW | $16.8 billion | $18.0 billion | −6.7% | +1.1% |
| Investors and owner-occupiers summed, NSW | $25.4 billion | $33.5 billion | −24.2% | −13.3% |
Each quarter against the same quarter a year earlier, Australia:
| Quarter | Investors | Owner-occupiers |
|---|---|---|
| December 2025 | +32.7% | +18.4% |
| March 2026 | +25.7% | +14.6% |
| June 2026 | +7.8% | +5.9% |
| September 2026 | −38.1% | −4.6% |
Where we differ
We agree on the direction. The split is starker than "pronounced". New loans to investors in the September quarter were 38.1% below a year earlier. New loans to owner-occupiers were 4.6% below a year earlier, and still 4.5% above two years earlier. Of the $17.9 billion fall in new lending for housing on a year earlier, $15.2 billion was investors': more than four-fifths. Investors took 30.4% of new lending for housing in the quarter, against 40.3% a year earlier. In NSW the pattern is the same and deeper: investors 44.6% below a year earlier, owner-occupiers 6.7%.
Across Australia, the fall on a year earlier first shows in the September quarter. In value, investors' new loans peaked in the December quarter 2025, the highest in the series, and have been below it in each quarter since. On a year earlier, though, in the June quarter they were still 7.8% above, and owner-occupiers' 5.9% above. Over the four quarters to September, investors' new loans were still 4.7% above the four quarters before, and owner-occupiers' 8.3% above: late 2025 was high. NSW's investors showed it a quarter sooner: in the June quarter their new loans were already 1.4% below a year earlier, while owner-occupiers' were 3.6% above.
Part of the investor fall is a high base, not all of it. A year earlier, in the September quarter 2025, new loans to investors had jumped 18.0% on the quarter before, to what was then the highest in the series. Against two years earlier, the September quarter 2024, they are 26.4% lower. They are below every quarter since the September quarter 2023, and within 1% of that quarter. These are dollars, not adjusted for prices.
The deepest fall on a year earlier since our series allows the comparison. The series we hold begins in the September quarter 2002, so changes on a year earlier begin in the September quarter 2003. Investors' 38.1% is the deepest of them, measured from a year-earlier quarter that was then the series' highest. The next deepest was 31.8%, in the March quarter 2023. In NSW, investors' 44.6% is the deepest too; the next were about 32%, in the March quarters of 2023 and 2016. NSW investors' new loans were about the level of the December quarter 2022, and otherwise the lowest since the March quarter 2021. As reported on 4 November, before these figures came out, investors' new loan commitments had fallen further than in any rate-rising cycle on record. We compare each quarter with a year earlier, not cycles; on that measure, from 2003, the September quarter's fall is also the deepest.
What the figures cannot say is why. The budget's proposed changes for investors and the rate rises, as reported, could each play a part, as could lenders' policies; the minutes, as reported, put the fall in part down to recent tax changes. A value is not a count: smaller loans, if prices fall, lower it too, and we do not hold the number of loans. The quarter ends on 30 September, so the rise of 3 November, as reported, is not in it.
Last time we said. In 2026-w45 we said that, in the banks' books, investor loans still owed all but stopped growing in September, and that a book stops growing when repayments match new loans, so a flat book can still hold new investor loans. These figures are a different measure, from more lenders, and they fit that: lenders still committed $24.7 billion of new loans to investors in the September quarter, 38.1% less than a year earlier. Falling new loans fit a book that has stopped growing; they are not the same thing.
How we measured
- ABS Lending Indicators, September quarter 2026: new loan commitments for housing, excluding refinancing, owner-occupier and investor, in $ million, seasonally adjusted, quarterly, for Australia and for NSW. The lenders in it are banks and other deposit-takers, and registered non-bank lenders, whose lending is above a reporting threshold, so not every new loan is in it. 2026-w45's figures were deposit-takers only.
- Every change is calculated by DwellDelta from those figures and printed to one decimal. Matched windows only: each quarter against the same quarter a year earlier, and two years earlier; the four quarters to September 2026 against the four quarters to September 2025. A quarter on the quarter before is printed once, for the September quarter 2025, to show the year-earlier base. The summed rows add the investor and owner-occupier series, each seasonally adjusted; they are not a separately published total.
- "The deepest", "the highest in the series" and "the lowest since" are read from the series as published in this release, which starts in the September quarter 2002. Values are in dollars of the day, not adjusted for prices.
- Seasonally adjusted figures are revised as each new quarter is added. NSW's June quarter 2026, as first published and frozen in 2026-w40, was $12,604.3 million for investors; it is now $12,329.7 million, 2.2% lower, and the owner-occupier figure 0.2% higher. The September quarter will be revised too. A revision that size could move the two level comparisons above (within 1% of the September quarter 2023; about the level of the December quarter 2022), but not which fall on a year earlier is the deepest.
- The headline claims are reported by their direction only, cited by date and not named, because DwellDelta names only sources it can use commercially.
- This is one edition and is not updated. Its inputs are frozen with the checksum of the file read, and every figure comes from a script that reads them.
Is your rent fair? Check it in a minute, and add yours to help others.
General information, not financial advice.
Sources
- Based on Australian Bureau of Statistics data: Lending Indicators (5601.0), September quarter 2026, © Commonwealth of Australia, licensed under CC BY 4.0 (creativecommons.org/licenses/by/4.0). The changes are calculated by DwellDelta from the ABS's figures. No endorsement by the ABS is implied.
- The minutes of the 3 November cash-rate decision: as reported on 17 November 2026; their pages refuse automated readers like ours in their robots rules, so we did not read them.
- Headlines: as reported on 4, 11, 12, 13, 15, 16 and 17 November 2026, cited by date and not named, because DwellDelta names only sources it can use commercially. They were found by web search, on 2026-11-08 for 4 November and on 2026-11-19 for the rest, and were not read in full.